
Instructional Technology
Infographics
Science
What type to use?
While there is no limitation to which infographics work best for you, there are some that have more application for certain contents than others. Here are some examples of ways to use these in a Social Studies class.
Examples

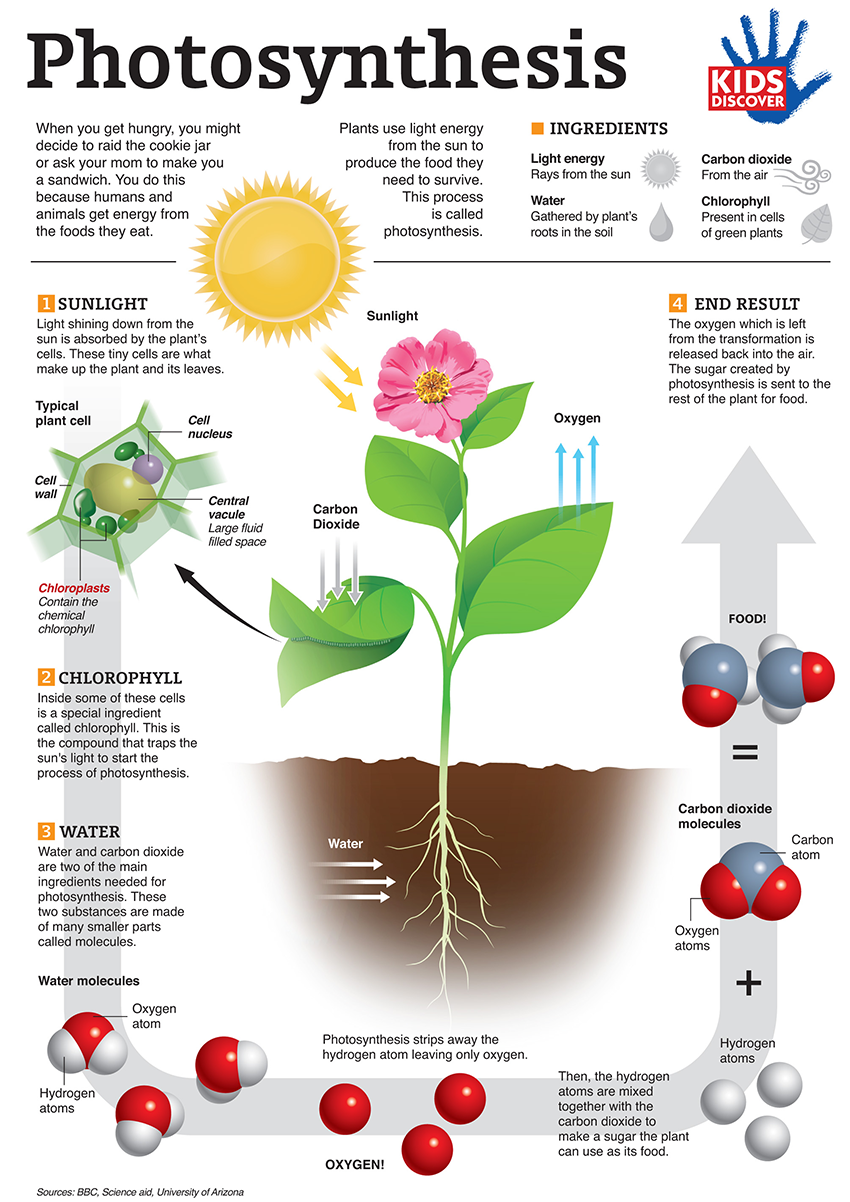
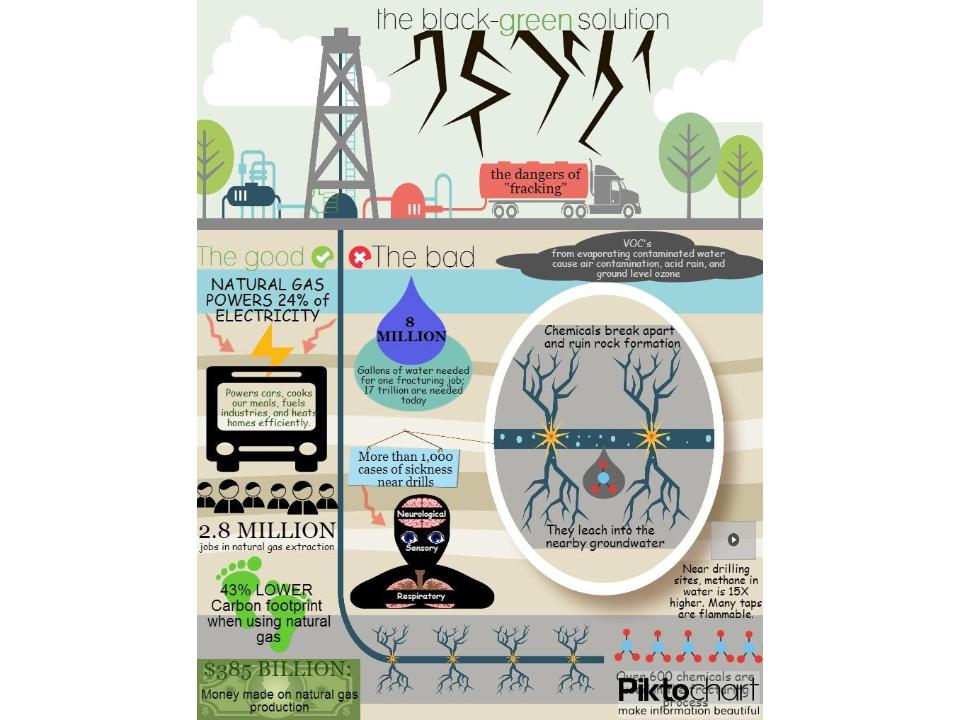
Timeline/Progress
This infographic is perfect when discussing various processes that occur in science. From photosynthesis, to the water cycle, to even creating a timeline to show the evolution of the atom or space travel.

Lists/Labeling
This infographic is great for labeling complex ideas, such as the parts of a cell, explaining the laws of physics, or discussing elements on the periodic table.
Professional
To see the full version, click HERE.
Student Examples
To see the full finished product, click HERE. These were made using Piktochart account.

More examples coming soon!
To see the full version, click HERE.